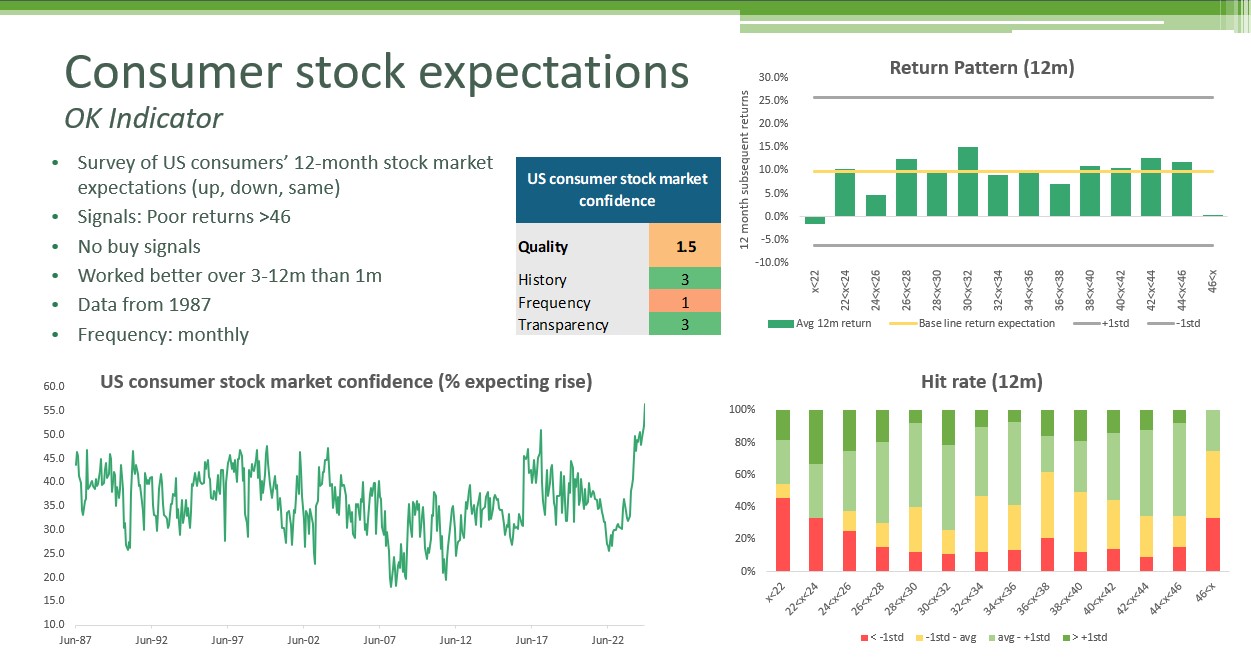
Americans are more bullish on equities than ever, which has historically been bad news for future returns. I rate this indicator 1.5 out of 3.
Not all Sentiment Indicators are created equal, Part 7 (you can find Parts 1-6 on LinkedIn)
Need to know:
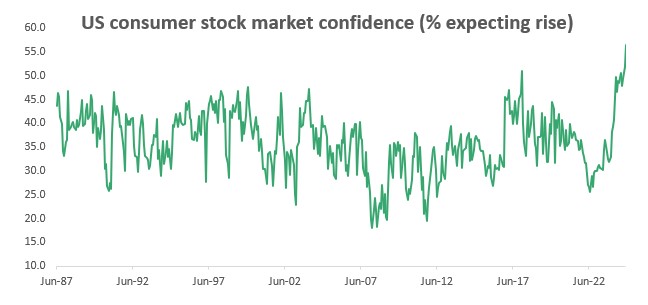
- What is it: A monthly survey by The Conference Board asking US consumers whether they expect the stock market to rise, fall, or stay the same in 12 months.
- The good: Long history (since 1987) and strong track record of sell signals at high consumer optimism levels.
- The bad: No value as a buy signal and only updates monthly.
- Current message: A record 56.4% of Americans expect rising equities, historically a bearish signal.
Go deeper
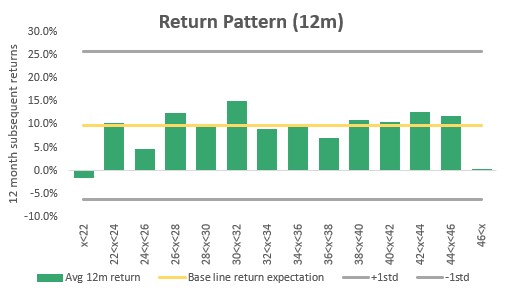
- Track record: This indicator has consistently sent useful signals. Equities perform worst when consumers are most bullish.
- Sell signals: When 46% or more of Americans expect rising equities, the S&P 500 averages 0% over the next year, with above-average returns only 25% of the time. Signals are weaker over very short time horizons.
- No buy signals: It’s ineffective as a contrarian buy indicator. Following low optimism levels, the S&P 500 has averaged -1.6% over the next month. It seems Americans follow the rule ‘if you must panic, panic early’. That’s great from consumers’ p&l perspective, but it makes for a poor contrarian buy indicator.
- History: The survey boasts a long history dating back to 1987, with a large and consistent sample size.
- Bull-Bear: Unlike other indicators (e.g., AAII), the pure bullish number is more effective than the difference between bulls and bears. For interpreting the current bullish extremes, though, it is worth considering that there are still more bears out there than you would expect. It seems many of the new bulls have come from the ranks of the neutrals.
- Transparency: The survey questions and response breakdowns are fully published. The only ask I have is more details about the sample size.
- Current level: At 56.4%, consumer bullishness is at an all-time high, a level historically followed by subpar equity returns.
Conclusion: The US consumer stock market expectations indicator is worth tracking, but it’s not one of my top-tier tools. Currently, it signals below-average equity returns ahead.
Thanks for reading Macro Equity! Subscribe for free to receive new posts and support my work.