The ISE Sentiment Indicator says ‘sell’, but take that with a pinch of salt, as it is better at buy signals than sell signals. I rate it 1 out of 3.
Not all Sentiment Indicators are created equal, Part 9
Need to know
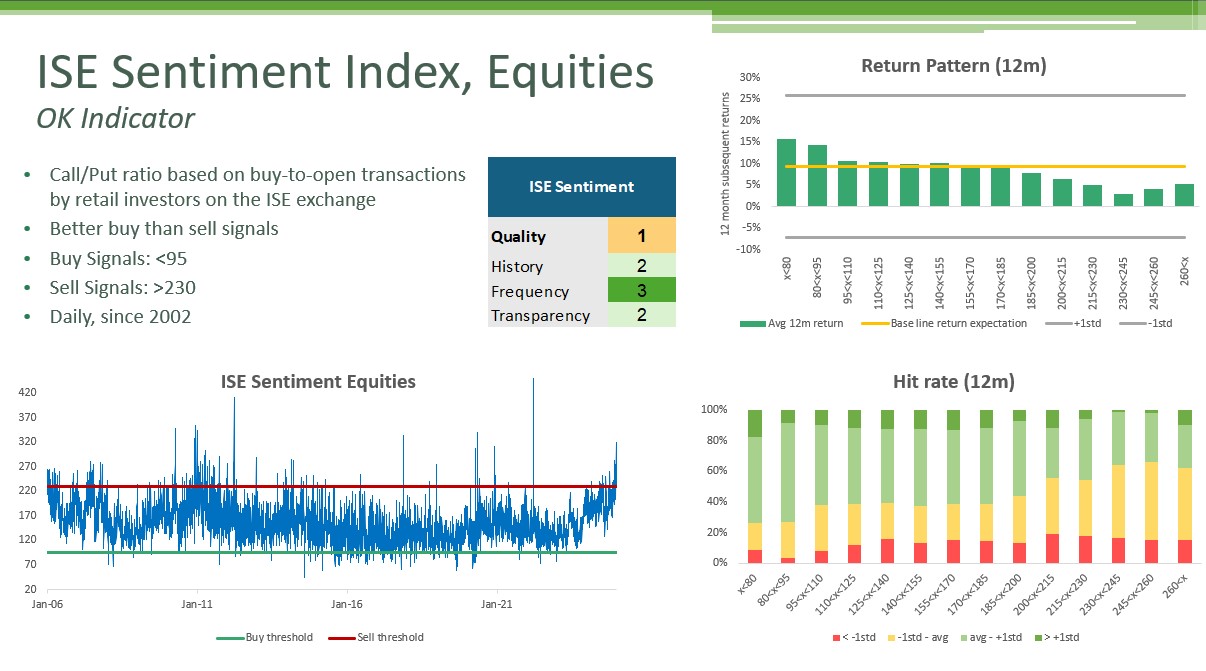
What is it: A call/put ratio based on buy-to-open transactions by retail investors on the ISE exchange.
The good: It’s different from classic put/call ratios, offers one of the few retail sentiment measures and has had an OK track record for predicting equity returns.
The bad: Signals have been weaker than top-tier indicators in terms of average returns and hit rates. It only tracks ISE exchange transactions, limiting its scope.
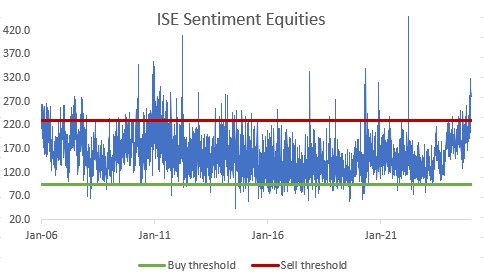
Current message: Sentiment shows extreme bullishness, historically associated with below-average 12-month equity returns.
Go deeper
Track record: While it has provided useful signals, they’ve been relatively weak. High ISE readings tend to precede poor equity returns, while low readings correspond with better performance. However, compared to top indicators, results have been less impressive.
Signals:
Sell signals: When ISE exceeds 230, the S&P 500 averages a 3.8% return over the next year, with below-average returns 59% of the time. Sell signals have been more reliable over longer horizons.
Buy signals: Have worked better. Below 95, the S&P 500 averages 14.7% over the next year, with above-average returns 73% of the time. Short-term returns have also been strong.
Different calculation: Unlike traditional put/call ratios, it includes only buy-to-open equity options trades, excluding ETFs and indexes, which are commonly used for hedging. The assumption is that this approach better reflects genuine market sentiment.
Different investors: By excluding short orders and trades from market makers and brokerages, it primarily captures retail sentiment. Retail indicators are rare, so even moderate accuracy adds value. The retail nature of the indicator is evident in its long-term average of 130, as retail investors are typically more active in calls than puts.
Small sample: The dataset is narrowed to improve signal quality but at the cost of coverage. The ISE accounts for less than 10% of US exchange-traded options volume, and further exclusions (e.g., market makers, ETFs, and short orders) reduce the sample size further.
Technical strengths: It is released daily with data going back to 2002, covering multiple cycles. High transparency with detailed methodology available.
Conclusion
The ISE Sentiment Indicator is more effective for buy signals than sell signals. Despite its limitations, it’s one of the few retail-focused indicators and is worth monitoring. The current ‘sell’ signal should be taken with caution, as sell signals have historically been less reliable, and this reading is an outlier.
Thanks for reading Macro Equity! Subscribe for free to receive new posts and support my work.