
Few assets have had a reversal in fortunes quite as severe as Brazilian equities over the past couple of months.
That alone makes contrarian ears prick up.
But the move is not just about price.
Alongside the absolute decline in Brazilian equities, and their sharp underperformance against emerging market peers, there has been an equally sharp reversal in the sentiment indicators we track.
The sell-off has taken our Brazil equity Sentiment Matters Aggregate from its 89th percentile all the way down to its 7th percentile — below levels that have historically been followed by outperformance at a high hit rate.
That sounds like a clean contrarian setup.
But a closer look at the data shows a more complex sentiment picture than the headline number suggests.
As always, this is not a call to “buy” or “sell” Brazil.
It is a sentiment note. And sentiment analysis is best used to do two things:
- Identify when optimism or pessimism has become sufficiently stretched that vulnerability shifts.
- Stress-test the prevailing narrative — where is the consensus most confident, and what would force a rethink?
Sentiment & positioning
We always start with the data.
Our Sentiment Matters Aggregate for Brazilian equities has fallen sharply from its spring highs.
As recently as April, the average indicator in our Heatmap sat at the 61st percentile. That took the SMA to its 91st percentile, close to the highest levels of the past three years.
Only a few weeks later, the average indicator had fallen to the 38th percentile and the SMA itself to the 6th percentile.
For context, the all-time low across indicators was in September 2025, when the average indicator fell to the 24th percentile.
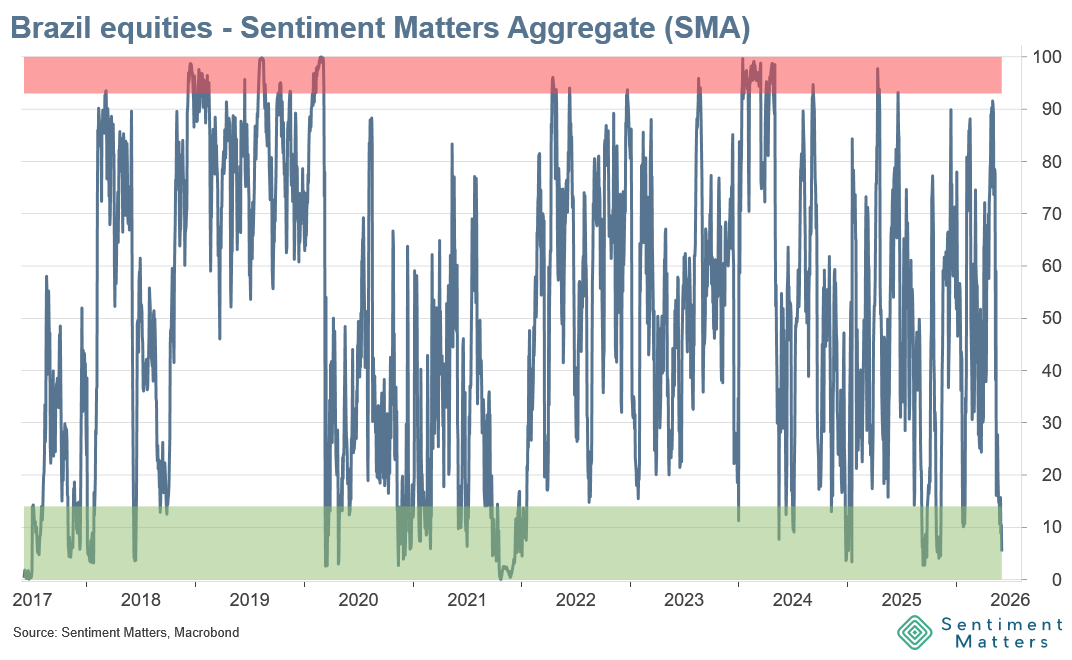
This leaves our Brazil equity SMA below the historical buy threshold at the 14th percentile.
An SMA below 14 has historically been followed by average Brazil outperformance versus EM of 17.6% over the next year, with a 71% hit rate of above-average outperformance.
The numbers improve further when the SMA has been below the 7th percentile, which is where it is today.
An SMA below 7 has been followed by average Brazil outperformance versus EM of 22.4% over the next year, with a 77% hit rate of above-average outperformance.
The historical buy threshold has also been stable over shorter time horizons, though the signal has been most reliable over 12 months.
Over very short horizons, the signal has been weaker. Momentum can still dominate over one month. Returns one month after an SMA below 7 have been only slightly above average, with a hit rate of above-average outperformance not far above 50%.