

I am adding a new set of sentiment indicators to the Sentiment Matters toolbox: Insider Activity.
These indicators capture purchases and sales by company insiders, adding another perspective to the surveys, positioning, flows and options activity we already follow.
The dataset stretches back to 2006, and many of the indicators back-test well in terms of predictive powers. Results vary across sectors, but one finding stands out: unusually widespread insider buying has generally been a more useful positive signal than low buying or selling has been a negative signal.
The indicators will feed into the sector-specific SMAs, Heatmaps and Chart Packs where the historical results support their inclusion.
What is it?
The data come from transactions reported to the US Securities and Exchange Commission by company directors, senior executives and certain large shareholders.
We focus on purchases and sales of common equity, excluding grants, option exercises, gifts and similar transactions.
For each year, we select 1,000 eligible US companies using market capitalisations to rank them. Each company receives equal weight, so large companies and individual transactions do not automatically dominate the sector readings.
We use monthly filing data to calculate four measures for each sector.
Purchase Breadth
Purchase Breadth measures the percentage of eligible companies with at least one insider purchase during the month.
A high reading means buying is widespread. A low reading means relatively few companies have reported insider purchases.
It does not require those companies to be net buyers. A company can have purchases and sales in the same month and still contribute to Purchase Breadth.
Buying Intensity
Buying Intensity measures net-buying companies as a percentage of net-buying plus net-selling companies.
Net buying and selling are determined using transaction dollar values.
This tells us about the balance among companies with a net buying or selling position. Companies with no activity, or an exactly neutral dollar balance, do not enter this denominator.
Net Breadth
Net Breadth takes the number of net-buying companies, subtracts the number of net-selling companies and divides the result by the full eligible sector universe.
It therefore captures the net balance relative to the whole sector, including companies with no activity.
That distinction matters. A net-buying imbalance spread across a large part of the sector produces a stronger Net Breadth reading than the same buying/selling proportions among only a handful of companies.
Net Buy Ratio
For each active company, Net Buy Ratio calculates purchase value minus sale value, divided by purchase value plus sale value. Those company ratios are then averaged equally across the sector.
A company with only purchases has a ratio of +1. A company with only sales has a ratio of −1. Companies with both sit between those extremes. Companies with no purchase or sale activity are excluded from the average.
Track record
The next question is whether these measures have historically helped identify stronger or weaker subsequent sector performance.
There is an important difference from many of the sentiment indicators we follow. For a conventional contrarian indicator, we tend to look for strong returns after extreme pessimism and poor returns after extreme optimism.
Insider activity works in the other direction. Strong insider buying can be a positive signal, rather than a warning that investors have become too bullish.
I tested all four indicators over 1, 3, 6 and 12 months. For each indicator, observations are grouped into percentile buckets, from low to high readings, and matched with subsequent relative returns.
The first step looks at average returns. I compare each bucket's forward relative returns with the long-term average and examine outcomes more than one standard deviation above or below that average. This gives a first read on whether insider activity extremes have been followed by meaningfully strong or weak performance.
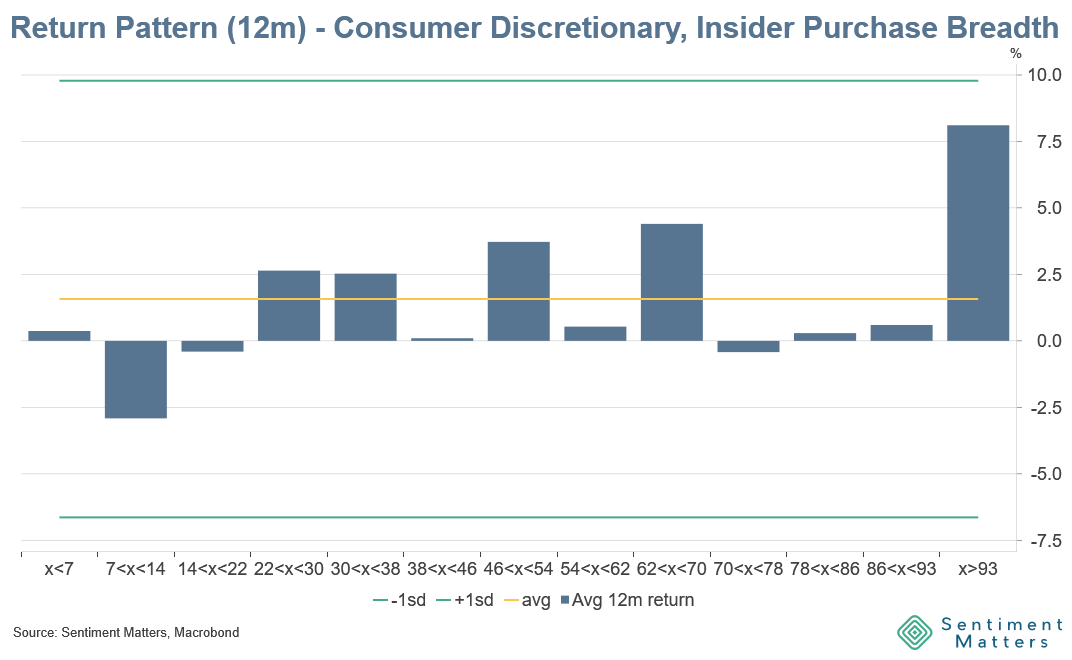
But averages can hide as much as they reveal. A few large moves can skew the picture.