

I love finding a genuinely new sentiment series to add to the Sentiment Matters toolbox. So I was very happy to discover the investor survey Stephan Heibel has been running at AnimusX for the past twenty years.
It is a unique dataset, covering a broad range of assets and including several indicators that back-test very well in terms of predictive power.
I am also very grateful to Stephan for letting me use the data in Sentiment Matters.
Do check out Stephan’s website and AnimusX, and consider participating in the survey. The more contributors, the better the data.
I am adding ten new AnimusX indicators to the Sentiment Matters toolkit. They will feed into the Risk-On/Risk-Off indicators as well as the asset-class-specific SMAs and Heatmaps.
What is it?
AnimusX is a weekly investor survey that has been running since 2006.
More than 2,000 investors are surveyed ahead of each weekend, with results split between private and institutional investors. The survey is typically conducted from Thursday to Saturday, with the results published ahead of the new trading week.
Several things make this an interesting dataset for Sentiment Matters.
First, it has a long history. A weekly series stretching back to 2006 covers very different market environments: the global financial crisis, the euro crisis, the pandemic, the inflation shock and several major equity, bond and commodity cycles.
Second, the survey goes well beyond a simple bullish/bearish question. It asks investors how they see markets, how they are positioned and, in some cases, what they intend to do next.
I am adding ten AnimusX indicators to the Sentiment Matters toolkit:
- DAX Commitment
- DAX Cash Rate
- DAX Investment Rate
- Bund Investment Rate
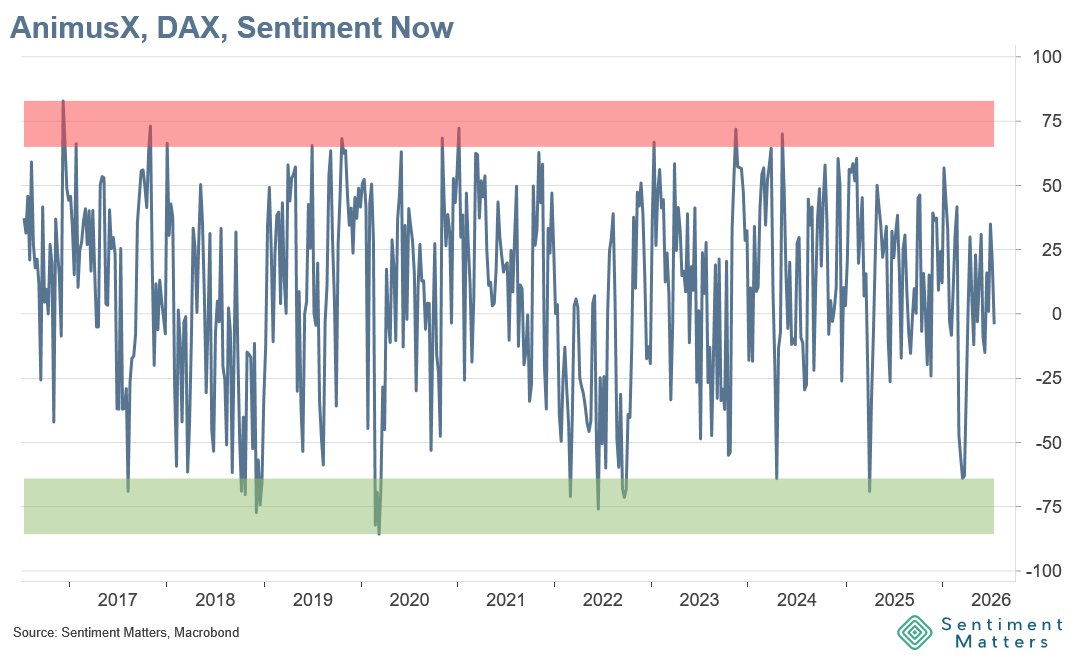
- DAX Sentiment Now
- Bund Sentiment Now
- Euro Sentiment Now
- Gold Sentiment Now
- Oil Sentiment Now
- Bitcoin Sentiment Now
They fall into three broad groups.
Sentiment Now
Six of the indicators measure current sentiment across the DAX, Bunds, the euro, gold, oil and Bitcoin.
They all use the same methodology.
Investors are asked which phase of the market cycle they believe an asset is currently in, for example whether it is rising, falling etc. The Sentiment Now indicator then compares the proportion of investors seeing an uptrend with the proportion seeing a downtrend.
A strongly positive reading means many more investors see an uptrend than a downtrend. A strongly negative reading means the opposite.
So the question is slightly different from surveys such as AAII, which ask whether investors have a bullish or bearish outlook.
Sentiment Now instead measures how investors perceive the market’s current phase, rather than simply asking whether they expect prices to rise or fall.
Investment Rates
The DAX Investment Rate and Bund Investment Rate are based on a survey question asking investors how heavily they are currently exposed to the relevant market relative to their total portfolio.
Respondents can report exposure ranging from leveraged long positions, through different levels of positive exposure, to zero exposure and short positions.
The responses are then weighted according to the size and direction of that exposure.
The result is therefore a measure of positioning, although importantly it is still based on a survey rather than a measurement of actual positions.
A high Investment Rate means investors are already heavily exposed. A low or negative reading means they are lightly invested or, at the extreme, positioned short.
A bullish investor who is lightly invested still has plenty of capacity to buy.
A bullish investor who is already fully invested has much less.
The Investment Rates therefore provide some insight into how much buying or selling capacity may still remain.
The Bund Investment Rate follows the same methodology, although the underlying survey question refers more broadly to bond-market exposure rather than specifically to Bund holdings.
DAX Cash Rate
The DAX Cash Rate is also derived from the same DAX exposure question.
There is no separate question asking investors directly how much cash they hold. Instead, the indicator uses reported equity exposure to identify more defensive positioning.
A high Cash Rate therefore points to lower equity exposure and, by implication, more uninvested capital.
A low reading suggests investors are more fully invested.
The exact calculation still requires one clarification, but conceptually the indicator can be thought of as a measure of available dry powder.
DAX Commitment
DAX Commitment is based on a different question.
Investors are asked how they intend to act with respect to new or existing positions over the next two weeks: buy or increase positions, sell or reduce positions, or remain undecided.
The Commitment indicator measures the proportion of respondents who have made a clear decision to act.
Both planned buying and planned selling count as commitment.
So the indicator does not measure bullishness or bearishness.
It measures how firmly investors have made up their minds.
A high reading means a large proportion of investors intend to act.
A low reading means more investors remain undecided.
Track record
The next question is whether these indicators have historically been useful from a contrarian perspective.
The starting point is straightforward.
I tested all of the indicators across four horizons: 1, 3, 6 and 12 months.
The mark of a useful contrarian sentiment indicator is that bearishness is followed by strong returns and bullishness by poor returns.
That is the pattern we are looking for.