One of the most common behavioural pitfalls in investing is cherry-picking — focusing on the data that supports your existing view or position while ignoring what doesn’t. It’s especially tempting when it comes to sentiment.
There are hundreds of sentiment indicators from dozens of sources, and inevitably some will point in opposite directions. At any given time, you can find indicators suggesting investors are overly bullish — implying you should be short — and others showing deep pessimism, suggesting you should be long. Without a consistent framework, it’s easy to fall into the trap of highlighting only the ones that fit your narrative.
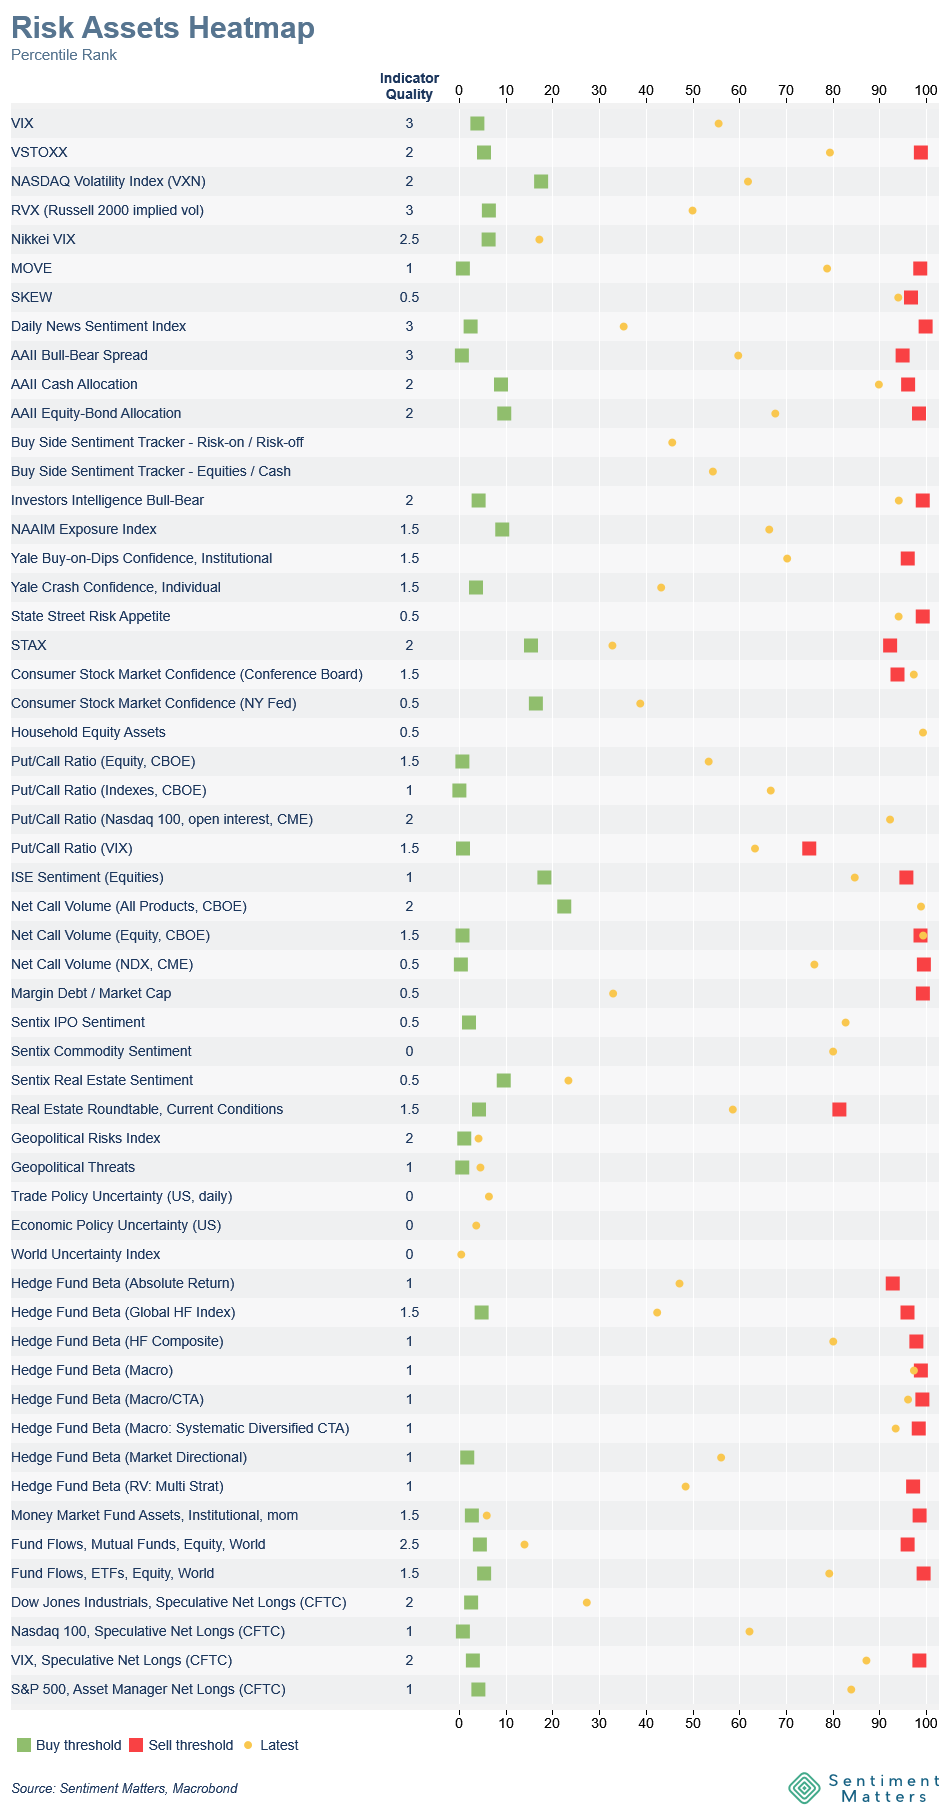
Right now, for example, if you’re bullish on equities, you might point to the AAII Bull–Bear spread, sitting at the 13th percentile, with 13% more Bears than Bulls. That looks like evidence investors are pessimistic, which could reinforce your view that it’s a good time to take equity risk.
But if you’re bearish, you might prefer the Investors Intelligence Bull–Bear survey, which shows 39% more Bulls than Bears — its 95th percentile reading — and might conclude that sentiment is dangerously optimistic and markets are due for a pullback.
In reality, neither of these readings tells the full story. Both are outliers within the broader universe of sentiment data.
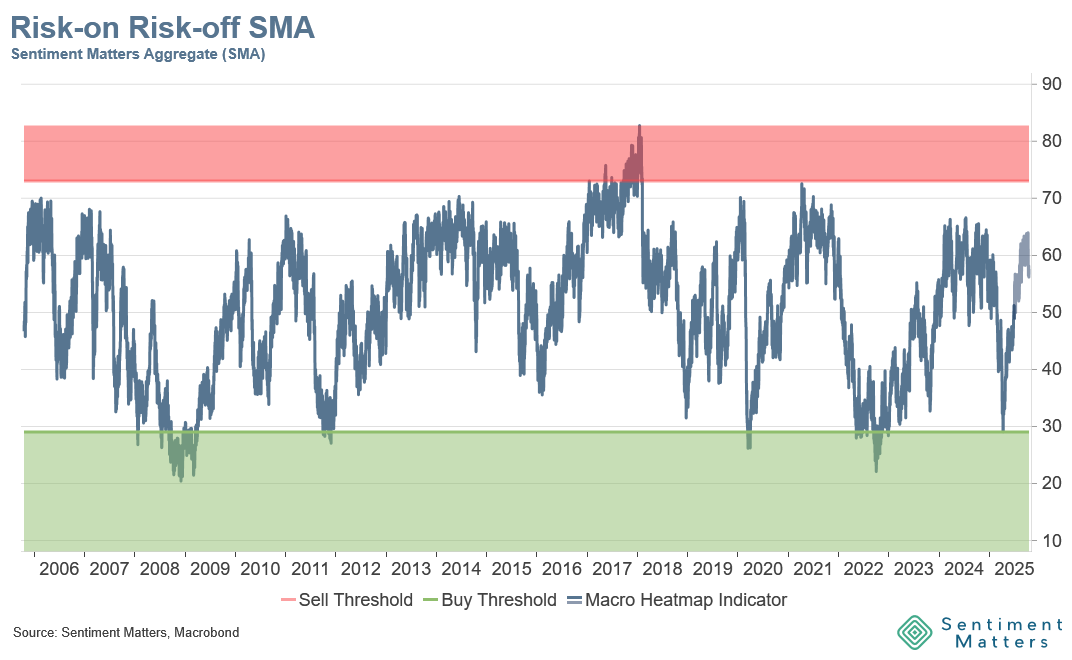
The chart below shows our Risk-on Risk-off Sentiment Matters Aggregate (SMA) across dozens of quality indicators, which currently sits at the 58th percentile. That is higher than most of the summer and below the 2024 high of 66. This zone typically corresponds to below-average 12-month equity returns.
An evidence-based approach to sentiment analysis starts with a framework that considers the breadth and reliability of multiple indicators rather than relying on a few that confirm your bias.
At Sentiment Matters, we use and back-test more than 400 sentiment indicators across asset classes to provide a more balanced, data-driven view of where investor sentiment truly stands.
The Heatmap below shows some of the big picture sentiment indicators we track and is one way to tackle the cherry picking challenge.