New Tool: Fixed Income Heatmap
Your fastest way to gauge fixed income sentiment.
The Challenge:
Most sentiment tools focus on broad risk appetite—not fixed income specifically.
The Solution:
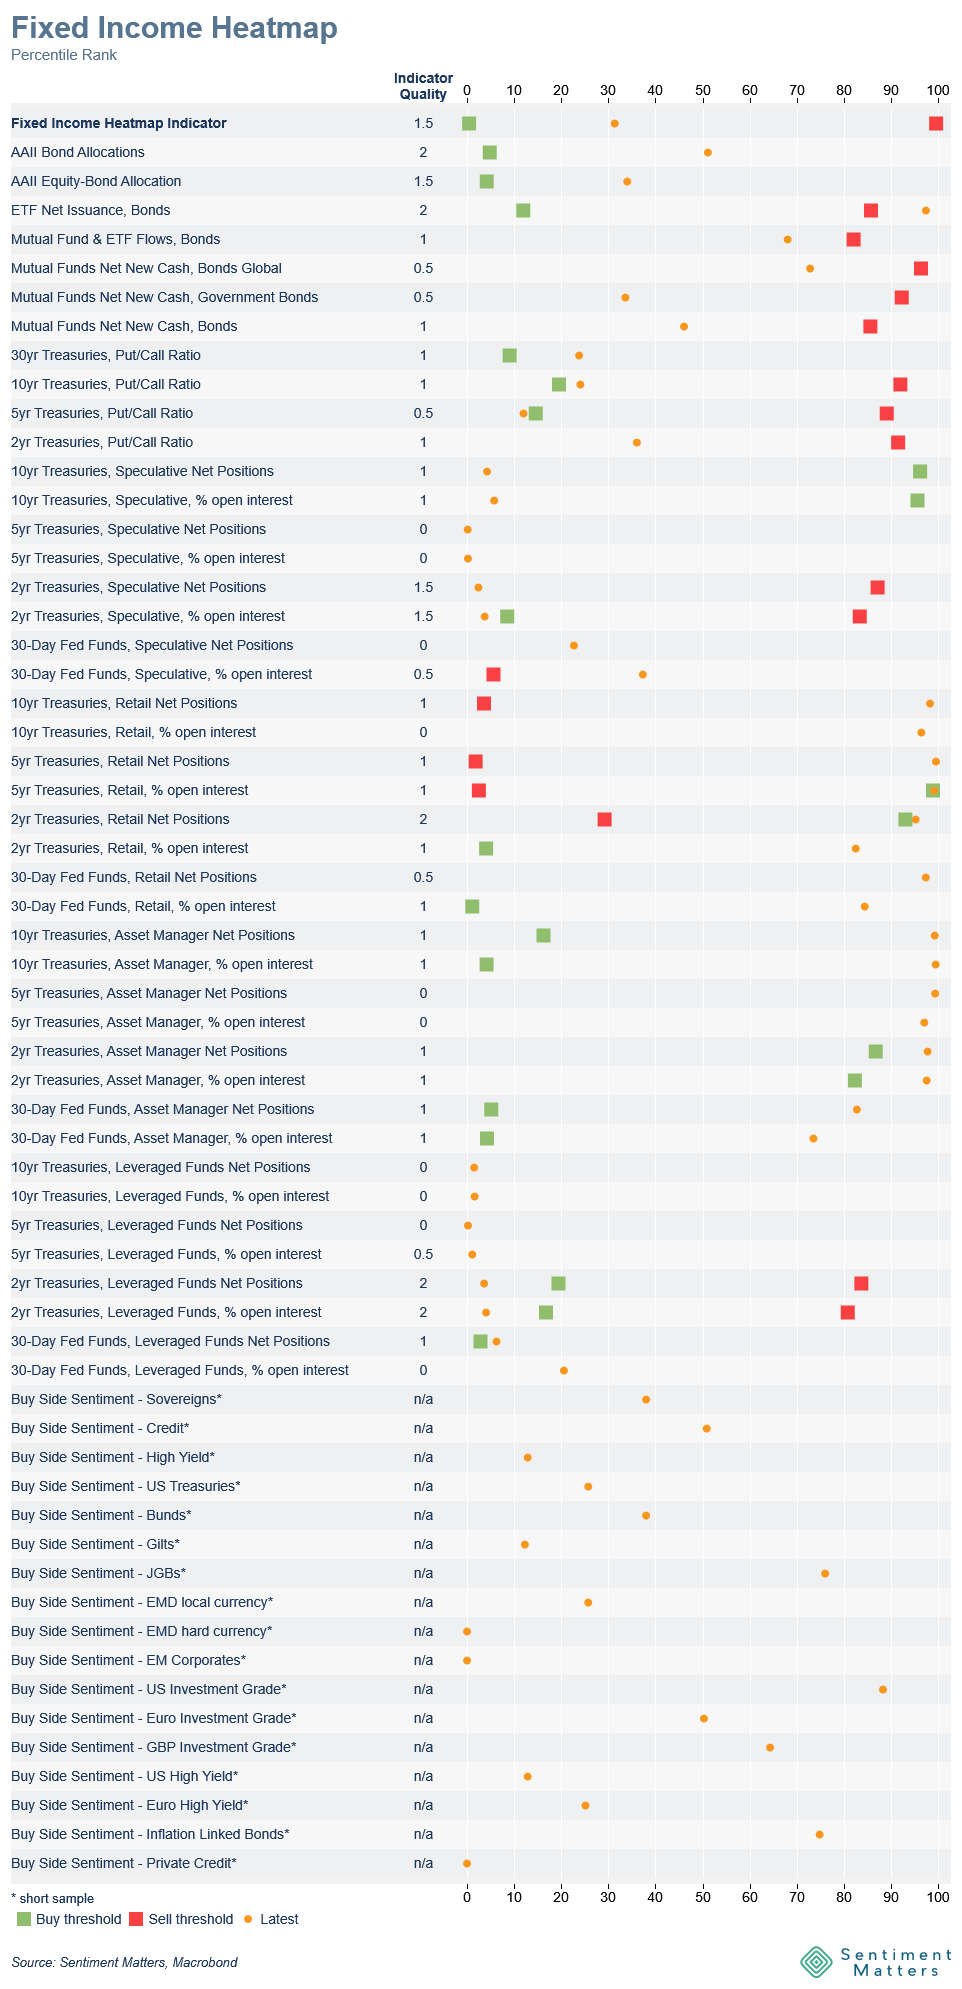
The Fixed Income Heatmap tracks sentiment across 61 bond-specific indicators, rated for quality, transparency, frequency, and history. Each is shown relative to its historical range and buy/sell trigger levels based on historic patterns.
What’s Inside:
Includes data from AAII, fund flows, put/call ratios, CFTC positioning, our proprietary Buy-Side Sentiment Tracker, and our own aggregated Heatmap Indicator.
Current Readings:
- Neutral overall: The Heatmap Indicator is at the 32nd percentile—a balanced, non-extreme reading.
- Fund flows: Mostly neutral, but ETF flows have spiked back into sell territory, continuing their outlier status this year.
- Put/Call ratios: Leaning bullish. 5yr Treasury put/call ratio at the 12th percentile is just within historical buy range.
- CFTC positioning: Split market—Speculators/Leveraged Funds are near extreme shorts; Retail and Institutional near historic longs.
- Buy-Side Tracker highlights:
- Least liked: JGBs, and everything US (US Treasuries, US IG, US High Yield)
- Favoured: Gilts, Bunds, Linkers, and of course Private Credit
Hope you like the Heatmap! Let me know what you think.