
Bitcoin in free fall. Let’s look at some data.
You can read plenty of posts today proclaiming the “Bitcoin ponzi” has finally imploded — and plenty more calling this a normal (temporary) crypto winter.
Rather than add to the noise, here is some sentiment data.
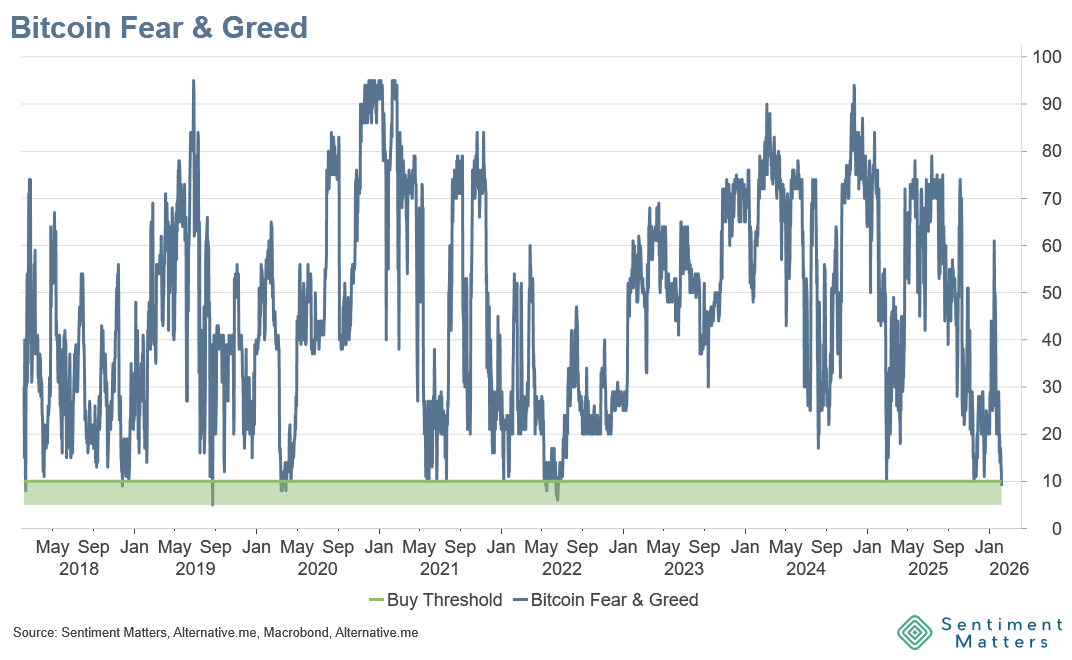
There’s less sentiment/positioning history for crypto than for more established asset classes, but Alternative.me’s Fear & Greed Index is one of the better gauges: daily frequency, transparent-ish construction, and a decent history for a new-ish market.
The numbers
- Fear & Greed: 9 (scale 0–100)
- Lowest since: summer 2022
- Percentile: 1st percentile of observations since Feb 2018
- A sharp reversal from the 95 peak in the weeks after Trump’s election
What does it mean?
At first glance, history says: extreme fear can be a good contrarian setup.
- When the index has been below 10, Bitcoin’s average 12-month return has been very strong (around +306% in the sample).
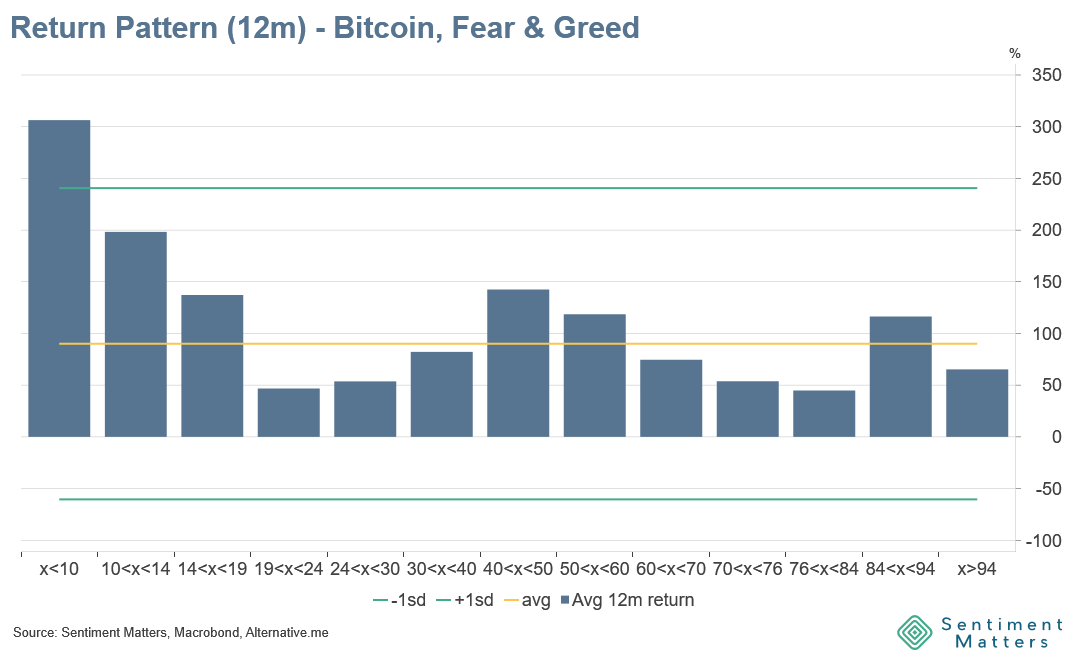
But the “average” hides a lot:
- Outcomes were highly bifurcated: a handful of cases saw +800%+ returns, while most of the others were below average (including one -55% 12-month outcome).
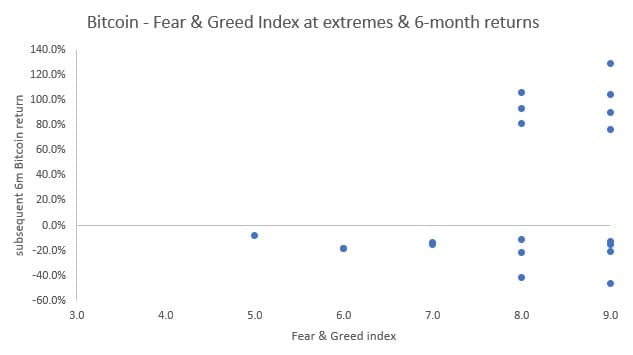
- Over shorter horizons, it’s weaker: 3–6 month returns have typically been below average, and over 6 months returns were negative ~two-thirds of the time.
Bottom line
- A 9 reading tells you sentiment is extremely bearish.
- It can be a long-term contrarian tailwind — but it’s not a timing tool.
- History also shows these pessimism regimes can stick around for weeks (2022 being the obvious reminder).
If you’re using this as a signal: it’s more about 12-month horizons than next week’s price action.